What Perplexity Comet can do for stock research
Perplexity Comet and Perplexity Computer offer a suite of AI-powered tools designed to streamline financial analysis. Perplexity Finance, launched in October 2024, combines large language models with real-time internet search and integrated financial data from Morningstar, SEC/EDGAR, Crunchbase, and FactSet. This allows the platform to provide answers with direct citations to source documents, enhancing reliability for investors.
The AI can automatically extract structured financial data from recent SEC filings, organize it into tables, and cite each line back to the original document. Perplexity AI also reads spreadsheets by converting uploaded files (CSV, XLSX, ODS) and connected Google Sheets into structured dataframes for conversational analysis. For portfolio management, Perplexity AI offers a Portfolio feature that connects brokerage accounts via Plaid for aggregation and analysis.
Perplexity Computer orchestrates 19 models on the Max tier, enabling autonomous multi-step tasks. Stanford researchers, for example, built an AI analyst using only public information that adjusted 3,300 mutual fund portfolios over 30 years, outperforming 93% of human managers by an average of 600%. Bristol-based investment research firms have used Perplexity Spaces to reduce research preparation time for monthly company coverage updates from three hours to under 40 minutes per company.
- Perplexity Comet is a free AI-powered browser and its core AI assistant is free.
- Perplexity Pro costs $20/month (or $17/month billed annually) and includes unlimited Pro Search and 20 Deep Research queries per day.
- Perplexity Max costs $200/month (or $167/month billed annually) and offers unlimited Labs and Perplexity Computer (10,000 monthly credits).
- Perplexity Enterprise Pro is $40/seat/month and Enterprise Max is $325/seat/month.
- Norway's sovereign wealth fund ($2.2 trillion) uses Claude to screen every stock entering their portfolio.
- Morgan Stanley uses a GPT-Powered assistant to help train their financial analysts.
The exact prompt we used
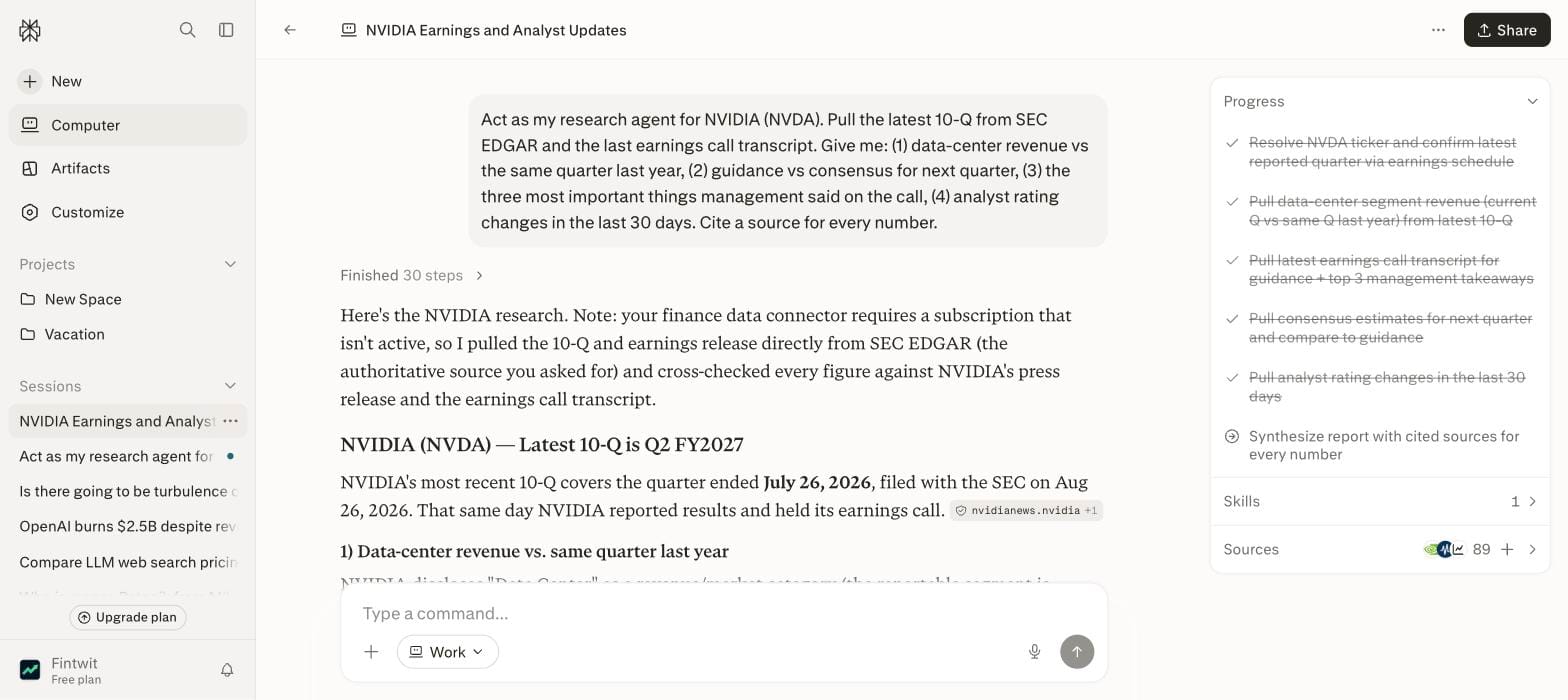
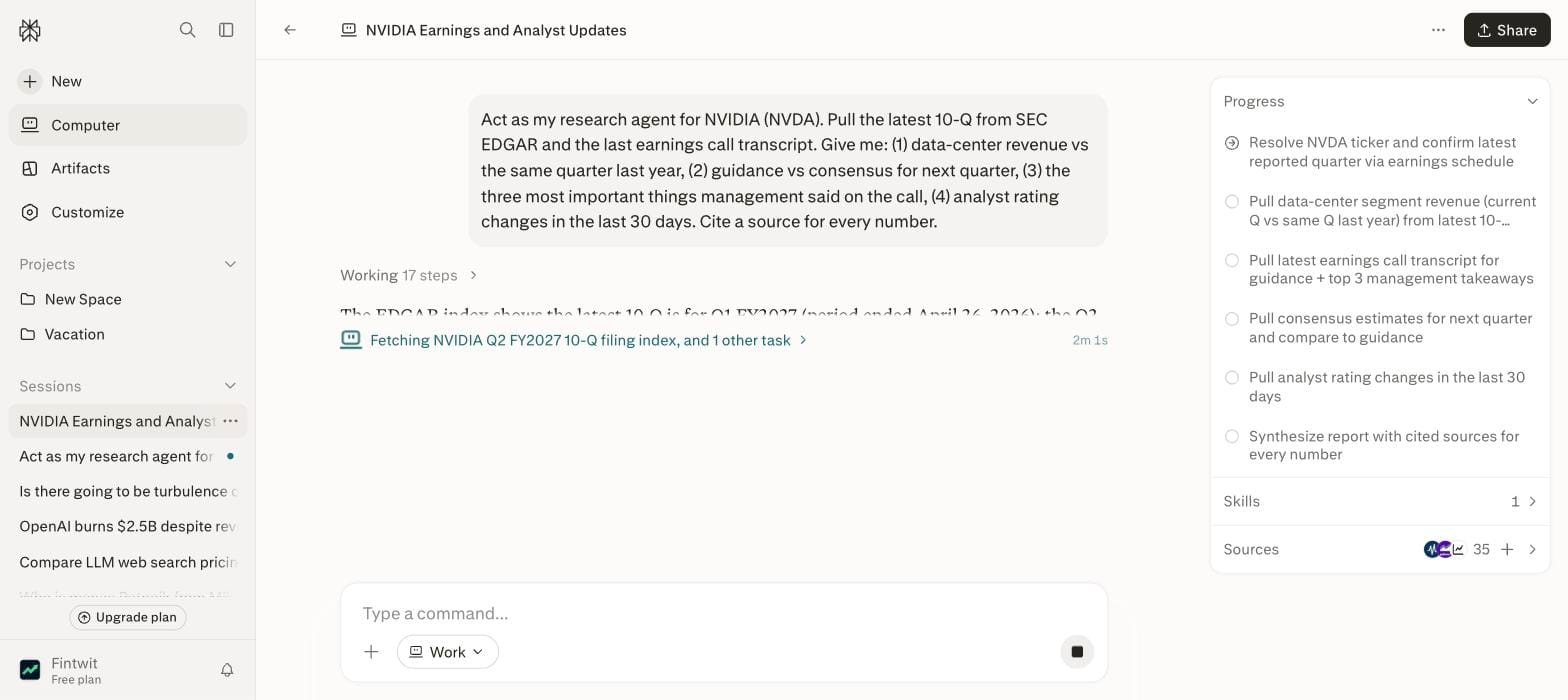
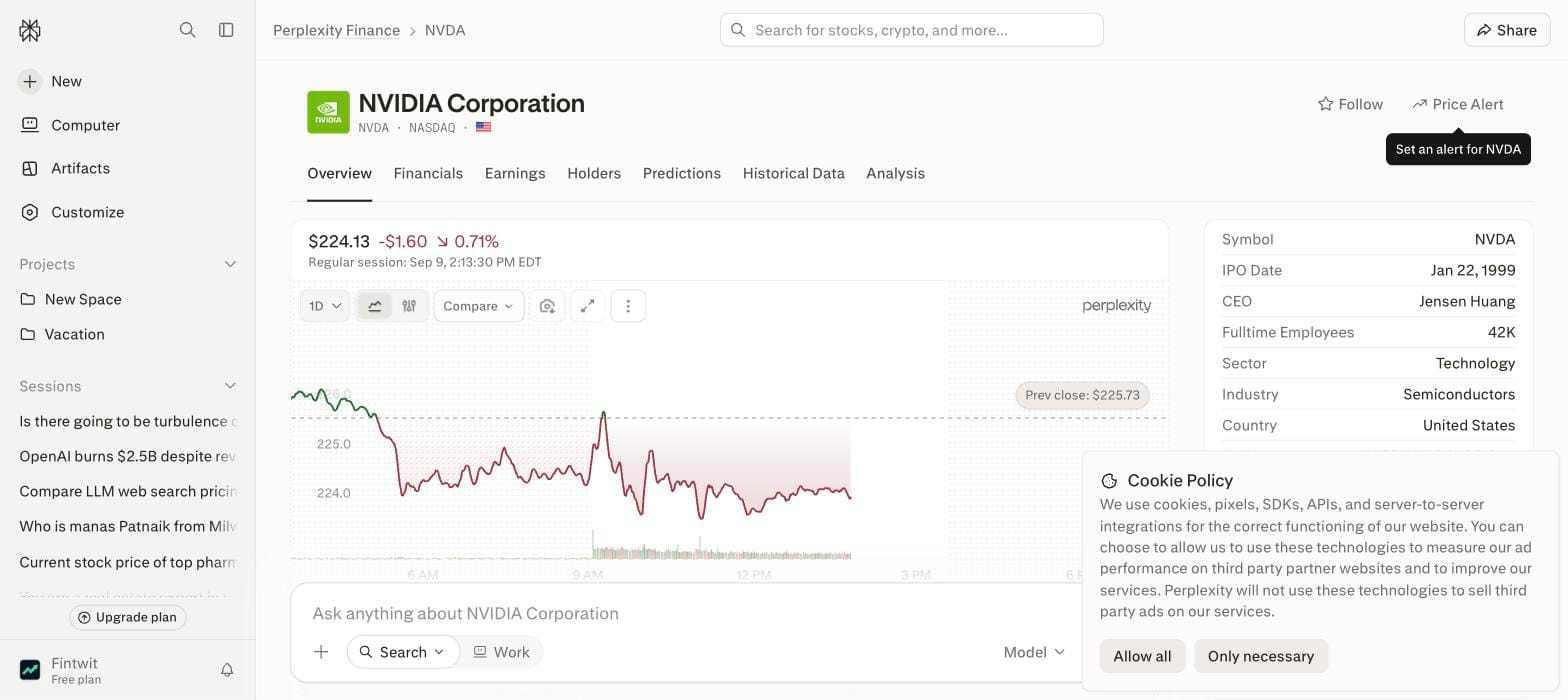
To generate the NVIDIA (NVDA) research for this post, we used the following prompt in Perplexity Comet. You can paste this prompt directly into Perplexity Comet to replicate the results for NVDA or adapt it for other AI stocks like AMD, PLTR, AVGO, or TSM. The output includes data-center revenue, guidance vs. consensus, key management commentary, and recent analyst rating changes, all with verifiable citations.
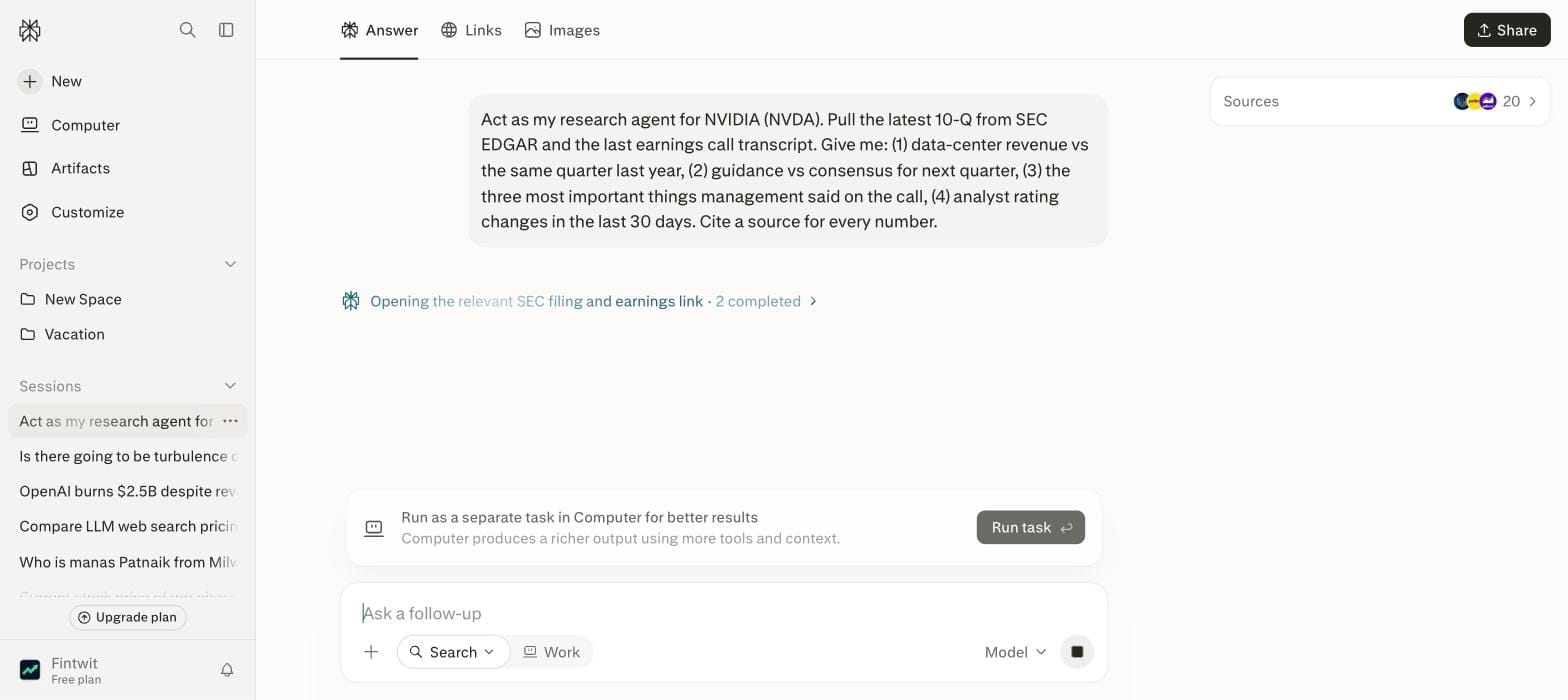
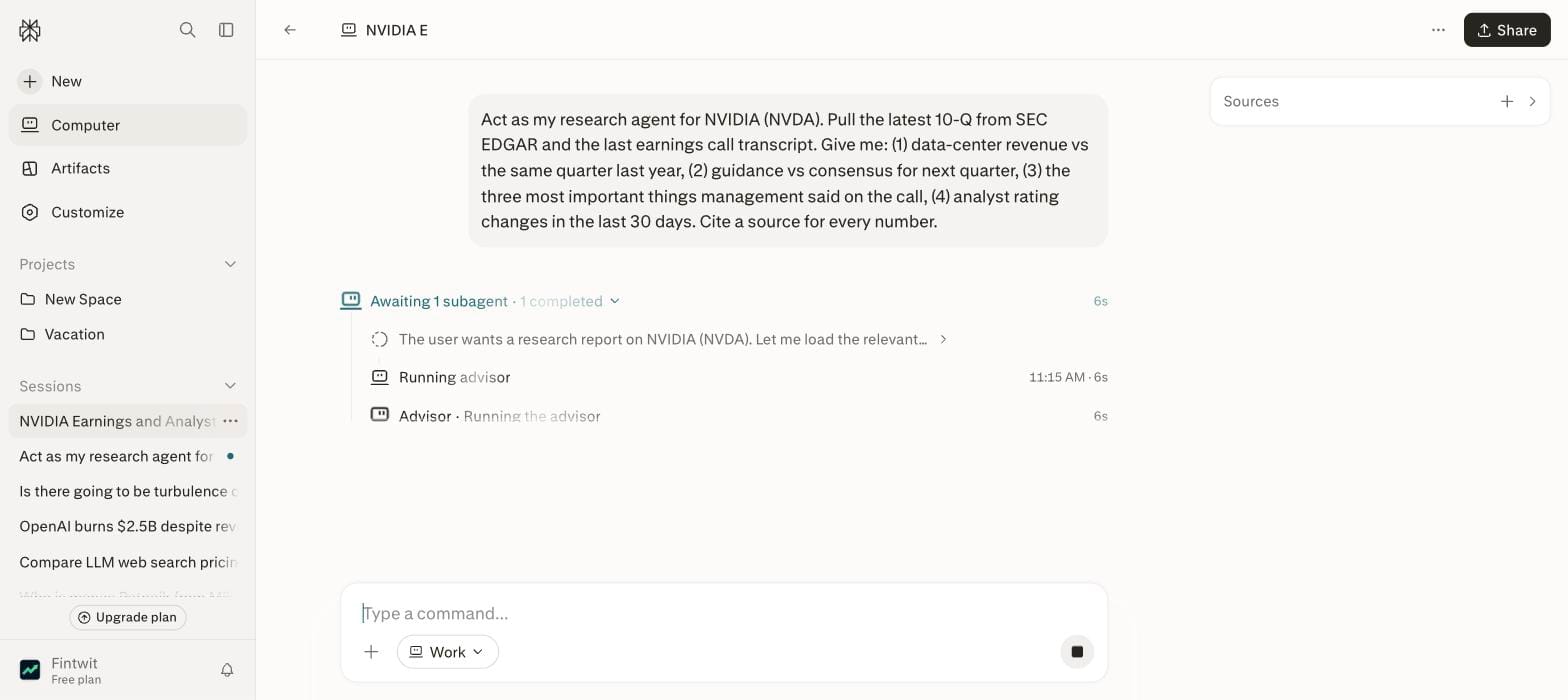
Act as my research agent for NVIDIA (NVDA). Pull the latest 10-Q from SEC EDGAR and the last earnings call transcript. Give me: (1) data-center revenue vs the same quarter last year, (2) guidance vs consensus for next quarter, (3) the three most important things management said on the call, (4) analyst rating changes in the last 30 days. Cite a source for every number.
10 more Perplexity Comet prompts for stock research
Perplexity Comet and Computer can execute a wide range of financial analysis tasks beyond a single company overview. The platform's ability to deconstruct complex queries into actionable sub-tasks and source data autonomously makes it suitable for comparative analysis, KPI extraction, and detailed financial statement reviews. Below are 10 additional prompts designed to leverage Perplexity Comet's capabilities for in-depth stock research, covering everything from peer comparisons to ESG metrics.
Peer 10-K Comparison
Compare the latest 10-K filings for [Company A], [Company B], and [Company C]. Extract and present a table showing their revenue, net income, and diluted EPS for the last three fiscal years. Include year-over-year percentage changes for each metric. Cite all numbers to their respective 10-K filings.
Consensus vs. Guidance
For [Company Name]'s upcoming earnings report, create a table comparing FactSet's consensus revenue and EPS estimates for the next two quarters against the company's most recently provided guidance. Highlight any significant discrepancies and cite both the FactSet data and the earnings transcript where guidance was given.
IR Site KPI Extraction
Browse the investor relations section of [Company Name]'s website. Identify and extract the five most important operational KPIs (Key Performance Indicators) that the company emphasizes. For each KPI, provide its latest reported value and the period it covers. Cite the specific page on the IR site where each KPI was found.
Analyst Ratings Summary
Provide a summary of current analyst ratings and 12-month price targets for [Company Name] using Perplexity's Finance mode. Include the consensus rating (e.g., Buy, Hold, Sell), the average price target, the highest target, and the lowest target. List the names of at least three analysts and their individual ratings/targets. Cite the source of this data.
52-Week Range Analysis
For [Company Name], report its current stock price, its 52-week high, and its 52-week low. Calculate the percentage difference between the current price and both the high and low. Briefly comment on where the current price stands within its 52-week range. Cite the exchange data source.
Debt Maturity Schedule
From [Company Name]'s most recent 10-K or 10-Q filing, extract its long-term debt maturity schedule. Present this information in a table showing the principal amounts due in each of the next five years and thereafter. Ensure each figure is cited to the specific section of the filing.
Executive Compensation Review
Locate the most recent proxy statement (DEF 14A) for [Company Name]. Extract and summarize the total compensation for the CEO and CFO for the last fiscal year. Identify the key components of their compensation (e.g., base salary, stock awards, bonus). Cite the relevant tables or sections in the proxy statement.
M&A Activity Overview
Using Perplexity's integrations with financial data providers, provide an overview of [Company Name]'s significant M&A activities over the past three years. List the acquired companies, the approximate acquisition dates, and any publicly disclosed deal values. Cite the sources for this information.
ESG Report Key Metrics
Find [Company Name]'s latest Environmental, Social, and Governance (ESG) report. Extract three key quantitative metrics from each of the Environmental, Social, and Governance sections (e.g., carbon emissions, employee diversity percentage, board independence). Report the metric, its value, and the reporting year. Cite the ESG report.
Competitor News Scan
Perform a live web search for recent news (last 3 months) concerning [Company A]'s primary competitors: [Competitor X], [Competitor Y], and [Competitor Z]. Summarize any significant developments (e.g., new product launches, major partnerships, regulatory issues) for each competitor in a concise paragraph. Provide links to the news articles.
Perplexity Comet vs Fintwit Chat
Perplexity Comet requires a structured prompt and often a paid tier (Pro or Max) to access its full suite of financial tools and autonomous agents. The process involves crafting specific queries and allowing the agent minutes to run and synthesize data from various sources like SEC filings and earnings transcripts. Users then manually verify the numbers against the provided citations.
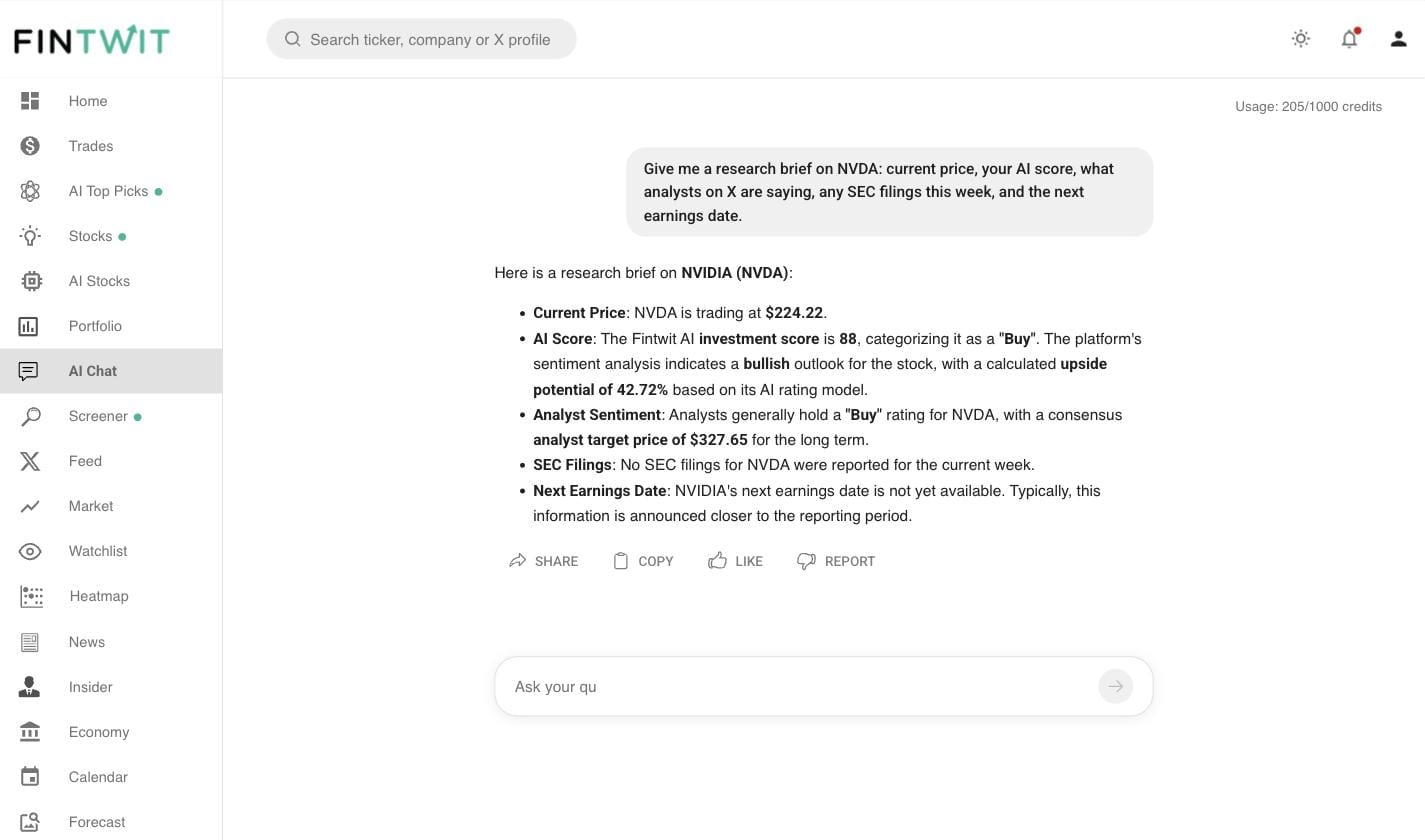
In contrast, Fintwit Chat provides immediate, concise answers for a given ticker without requiring prompt engineering or a paid subscription. For example, querying Fintwit Chat on a ticker like NVDA instantly returns the live price, Fintwit's proprietary AI score, analyst sentiment signals from X (formerly Twitter), and upcoming filings and earnings dates, all in a single, unprompted response.
- Perplexity Comet requires a written prompt and minutes of run time.
- Perplexity Comet often requires a paid tier (Pro or Max) for advanced features like Perplexity Computer.
- Perplexity Comet provides detailed, cited data from SEC filings, earnings calls, and FactSet.
- Fintwit Chat returns live price, AI score, analyst signals from X, and key dates instantly.
- Fintwit Chat requires no prompt engineering for basic ticker information.
| Feature | Perplexity Pro ($20/mo) | Fintwit ($9/mo) |
|---|---|---|
| Real-time market data | No | Yes — live prices & signals |
| AI stock analysis | Manual prompts required | Automatic for any stock |
| AI portfolio health check | Not available | Built-in with recommendations |
| Curated AI stock picks | Not available | Daily AI top picks & ETFs |
| Stock screener | Not available | Full screener with filters |
| Trending stocks from X | Not available | Real-time signal extraction |
| Earnings & dividend calendar | Not available | Built-in calendars |
| Brokerage integration | Not available | Connect Robinhood, Schwab, etc. |
| Price | $20/mo | $9/mo |
Where Perplexity Comet falls short
- Perplexity Free includes about 5 Pro Search queries per day, limiting extensive research.
- Perplexity Pro includes 20 Deep Research queries per day, which can be insufficient for intensive analysis.
- Perplexity Max includes 10,000 monthly credits for Perplexity Computer, but complex tasks can consume credits quickly.
- A segment of the Perplexity subreddit has noted that deep research is rate-limited to roughly 10 prompts per week, not unlimited as sometimes implied.
- Comet's browser-first design is not optimized for team workflows, making collaboration challenging.
- Perplexity's free tier has limited file uploads (40 MB per file, 30-day retention), restricting data analysis for larger datasets.
Pro tips
- Utilize Perplexity Finance mode for dedicated financial research, leveraging its integration with Morningstar, SEC/EDGAR, Crunchbase, and FactSet.
- Always deconstruct complex queries into discrete, actionable sub-tasks to optimize agent performance and ensure comprehensive results.
- Prioritize official sources like SEC EDGAR for filings and reputable financial data providers for consensus estimates and market data.
- For every numerical data point, verify the inline citation linking directly to the specific source document.
- Connect your brokerage accounts via the Portfolio feature to aggregate and analyze your holdings in one place.
- Leverage Perplexity Computer's autonomous multi-step tasks for comparative analyses of peers or detailed KPI extractions from investor relations sites.