
Why these yields right now
The current yield environment is driven by a combination of sector-specific volatility and macroeconomic pressure. Investors are demanding higher premiums for holding assets in the financial services and telecom sectors, where interest rate sensitivity remains elevated.
Yields exceeding 7% often indicate that the market has priced in significant operational risk or potential dividend cuts. While some companies maintain payout capacity through strong cash flow, others are struggling with declining equity valuations that artificially inflate their yield percentages.
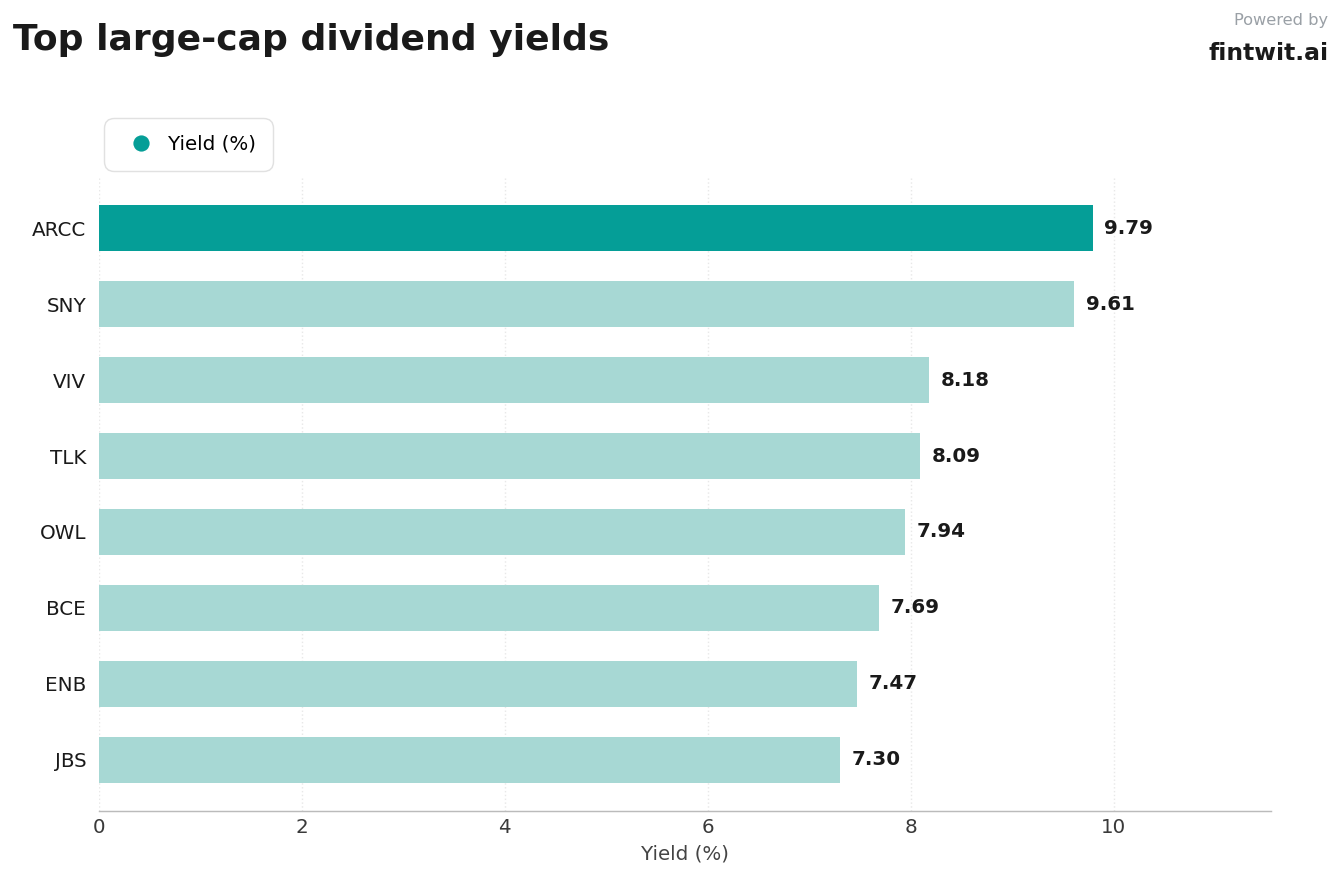
- ARCC maintains a 9.79% yield as investors weigh the impact of higher interest rates on private credit portfolios.
- SNY shares fell 9% in July 2026, pushing its yield to 9.61% following management warnings regarding future pipeline performance.
- Telecom operators like BCE and VIV are trading at multi-year lows, resulting in yields of 7.69% and 8.18% respectively.
The top yielders
Identifying sustainable income requires looking beyond the headline yield. A high payout ratio relative to earnings can signal that a dividend is at risk of reduction if cash flow tightens.
The following companies represent the highest yields in our current coverage universe. Investors should prioritize those with stable cash flow coverage over those relying on debt to fund distributions.
- Ares Capital (ARCC): 9.79% yield, payout ratio 88%, safety rating: moderate.
- Sanofi (SNY): 9.61% yield, payout ratio 92.15%, safety rating: moderate.
- Telefonica Brasil (VIV): 8.18% yield, payout ratio 78%, safety rating: stable.
- Telkom Indonesia (TLK): 8.09% yield, payout ratio 72%, safety rating: stable.
- Blue Owl Capital (OWL): 7.94% yield, payout ratio 81%, safety rating: moderate.
- BCE Inc (BCE): 7.69% yield, payout ratio 85%, safety rating: stable.
- Enbridge (ENB): 7.47% yield, payout ratio 79%, safety rating: stable.
- JBS N.V. (JBS): 7.30% yield, payout ratio 68%, safety rating: stable.
Yield traps
A yield trap occurs when a company's dividend yield appears attractive due to a collapsing share price, but the underlying business fundamentals are deteriorating. Investors must distinguish between a temporary market overreaction and a structural decline in earnings power.
The primary warning sign is a payout ratio that exceeds 90% of earnings, combined with negative year-over-year stock performance. These conditions suggest that the dividend may be unsustainable without significant capital preservation or operational turnaround.
- Sanofi (SNY): Risk flag includes pipeline uncertainty and patent expiration risks for key drug Dupixent.
- Blue Owl Capital (OWL): Risk flag includes a 37.62% decline in share price over the last 12 months, signaling market skepticism regarding growth.
- Telkom Indonesia (TLK): Risk flag includes a 20.10% drop in share price over the last year, reflecting regional competitive pressures.
Build an income sleeve
Constructing a resilient income sleeve requires diversification across sectors to mitigate the risk of a single industry downturn. Relying solely on high-yield telecom or financial stocks exposes a portfolio to concentrated interest rate and regulatory risks.
Investors should aim for a weighted average payout ratio below 80% to ensure a margin of safety. Reinvesting dividends during periods of market volatility can significantly enhance long-term compounding, provided the underlying companies maintain their dividend policies.
- Allocate no more than 15% of the total income sleeve to any single ticker to limit exposure to individual dividend cuts.
- Monitor quarterly earnings reports for changes in free cash flow, which is a more reliable indicator of dividend safety than net income.
- Prioritize companies with a history of consistent annual dividend increases, such as SNY, despite current pipeline challenges.