
The headline number
Marathon Petroleum Corp currently trades at a market capitalization of $83.74 billion. The 10.34 P/E ratio suggests a discount relative to broader energy sector multiples.
Independent research from Simply Wall St estimates the intrinsic value of MPC between $396.00 and $401.00 per share. This range implies significant upside from the current trading price of $320.32.
- Current Price: $320.32
- P/E Ratio: 10.34
- Dividend Yield: 1.34%
- 180-Day Performance: +53.53%
- Fair Value Estimate (Simply Wall St): $396.00 - $401.00
- Fair Value Estimate (ValueInvesting.io): $439.17
Peer comparison
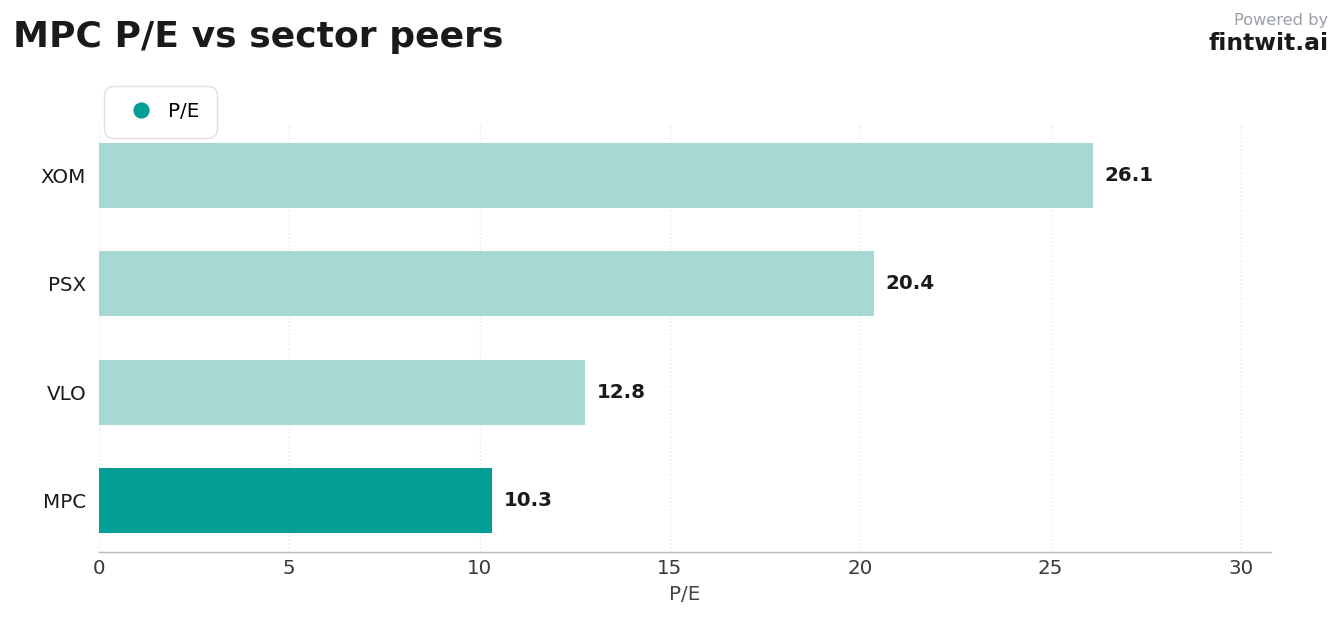
MPC maintains a lower valuation multiple compared to its primary integrated downstream and upstream peers. This valuation gap persists despite the company's aggressive share repurchase program.
The following data compares MPC against key industry competitors to highlight the relative discount in current pricing.
- MPC: 10.34 P/E
- VLO (Valero Energy Corp): 12.78 P/E
- PSX (Phillips 66): 20.35 P/E
- XOM (Exxon Mobil Corp): 26.10 P/E
Bull vs bear
The bull case centers on structural capacity constraints and a disciplined capital allocation framework. Conversely, the bear case highlights the inherent volatility of refining margins.
Management expects to maintain an enhanced mid-cycle environment through 2027, projecting 94% utilization for Q3 2026.
- Bull: Strong cash flow from high-utilization refining assets and stable MPLX midstream contributions.
- Bull: $8.63 billion share repurchase authorization as of May 2026 reduces share count.
- Bull: Structural industry capacity constraints on the U.S. West Coast support elevated margins.
- Bear: Refining margins are highly cyclical and sensitive to global macro fluctuations.
- Bear: Regulatory pressures like California's SB X1-2 increase operating costs.
- Bear: Recent price appreciation may outpace fundamental growth, risking a correction.
Fintwit's AI verdict
The quantitative model suggests that the current valuation fails to fully account for the company's aggressive capital return program and operational efficiency gains. While macro risks remain, the internal cash flow generation provides a buffer that the market has yet to price in fully.
Investors should monitor the sustainability of current crack spreads as a primary indicator for future earnings revisions.