
How we screened
We filtered for companies with a market capitalization exceeding $10 billion to ensure liquidity and institutional coverage. The primary metric for inclusion was a trailing P/E ratio below 6.5, a threshold significantly lower than the S&P 500 average.
We then cross-referenced these valuations against free cash flow yield and analyst sentiment to separate fundamental value from distress. The resulting list highlights companies where the market has applied a heavy discount, often due to sector-specific headwinds or macroeconomic sensitivity.
- Universe: Large-cap stocks with market caps > $10 billion.
- Metric: Trailing P/E ratio < 6.5.
- Filter: Excluded companies with negative free cash flow unless specific growth catalysts were identified by analysts.
- Data source: Market data as of October 2024.
The list
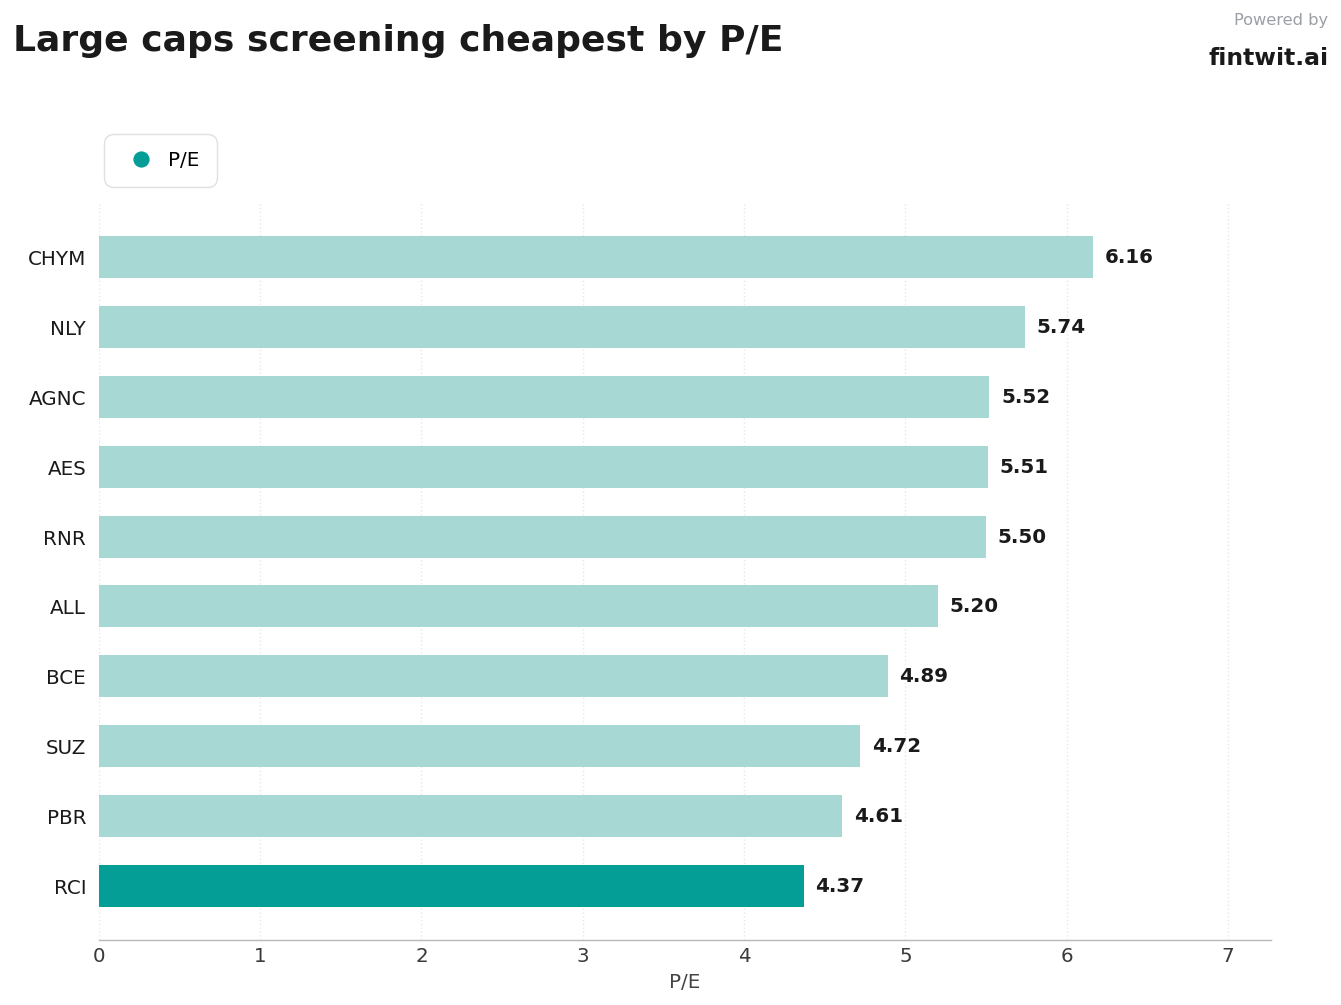
The following companies represent the lowest P/E multiples in the current large-cap landscape. Each entry includes the current P/E and the primary driver behind the valuation gap.
- Rogers Communications (RCI): 4.37 P/E. Regulatory oversight and high debt limit growth; consensus expects earnings to decline 8.58% in 2026.
- Petroleo Brasileiro (PBR): 4.61 P/E. Political risk and governance concerns weigh on the stock, though analysts argue the market over-penalizes these factors.
- Suzano (SUZ): 4.72 P/E. Cyclical pulp prices and debt profiles create a value trap risk, with a moderate GuruFocus score of 61.
- BCE Inc (BCE): 4.89 P/E. High debt and capital expenditure requirements restrict strategic flexibility, according to MarketBeat.
- The Allstate Corporation (ALL): 5.20 P/E. P&C insurance market softness drives the discount, though the multiple is half the peer average of 10.2x.
- Renaissancere Holdings (RNR): 5.50 P/E. Sensitivity to catastrophe losses and soft reinsurance pricing justify the current discount.
- The AES Corporation (AES): 5.51 P/E. Execution risk and negative earnings surprises have driven a long-term share price decline.
- AGNC Investment (AGNC): 5.52 P/E. Interest rate sensitivity and mortgage spread volatility drive sentiment-based selling.
- Annaly Capital Management (NLY): 5.74 P/E. High leverage makes equity susceptible to loss, warranting a cautious valuation.
- Chime Financial (CHYM): 6.16 P/E. Market skepticism regarding fintech profitability persists, despite Piper Sandler raising the target price to $35.
Caveats
A low P/E ratio is not a guarantee of future returns. In many cases, the market is pricing in a permanent impairment of earnings power or structural decline.
Investors must distinguish between cyclical volatility and permanent capital loss. For companies like RCI or BCE, the debt burden is a structural constraint that will not disappear when the economic cycle turns.
- High dividend yields, such as PBR's 20.2%, can be a sign of market expectation for future dividend cuts.
- Negative free cash flow, seen in AES and NLY, indicates that earnings may not be supported by actual cash generation.
- Political and regulatory risks, particularly in emerging markets or telecommunications, are difficult to model and can lead to sudden valuation compression.
- Reinsurance stocks like RNR are inherently volatile due to the unpredictable nature of catastrophe events.
How to use this screen
Use this list as a starting point for fundamental research rather than a buy list. The goal is to identify which companies are mispriced by the market and which are correctly priced for their underlying risks.
Focus on the free cash flow yield to verify if the earnings are real. Companies with high P/E discounts but strong cash flow, such as ALL or RNR, may offer better risk-adjusted returns than those with high debt and negative cash flow.
- Compare the P/E ratio against the 5-year historical average for each ticker.
- Review the debt-to-equity ratio to ensure the company can survive a high-interest-rate environment.
- Monitor upcoming earnings reports for revisions to forward guidance, which often act as the primary catalyst for valuation re-rating.