
How we screened
We filtered for large-cap equities with market capitalizations exceeding $10 billion and P/E ratios below 6.0. This screen identifies companies that the market currently prices at a significant discount relative to historical earnings.
The objective is to distinguish between companies facing structural deterioration and those suffering from temporary sentiment shifts. We categorized each pick based on whether the low valuation is earned through poor fundamentals or unearned due to market overreaction.
The list
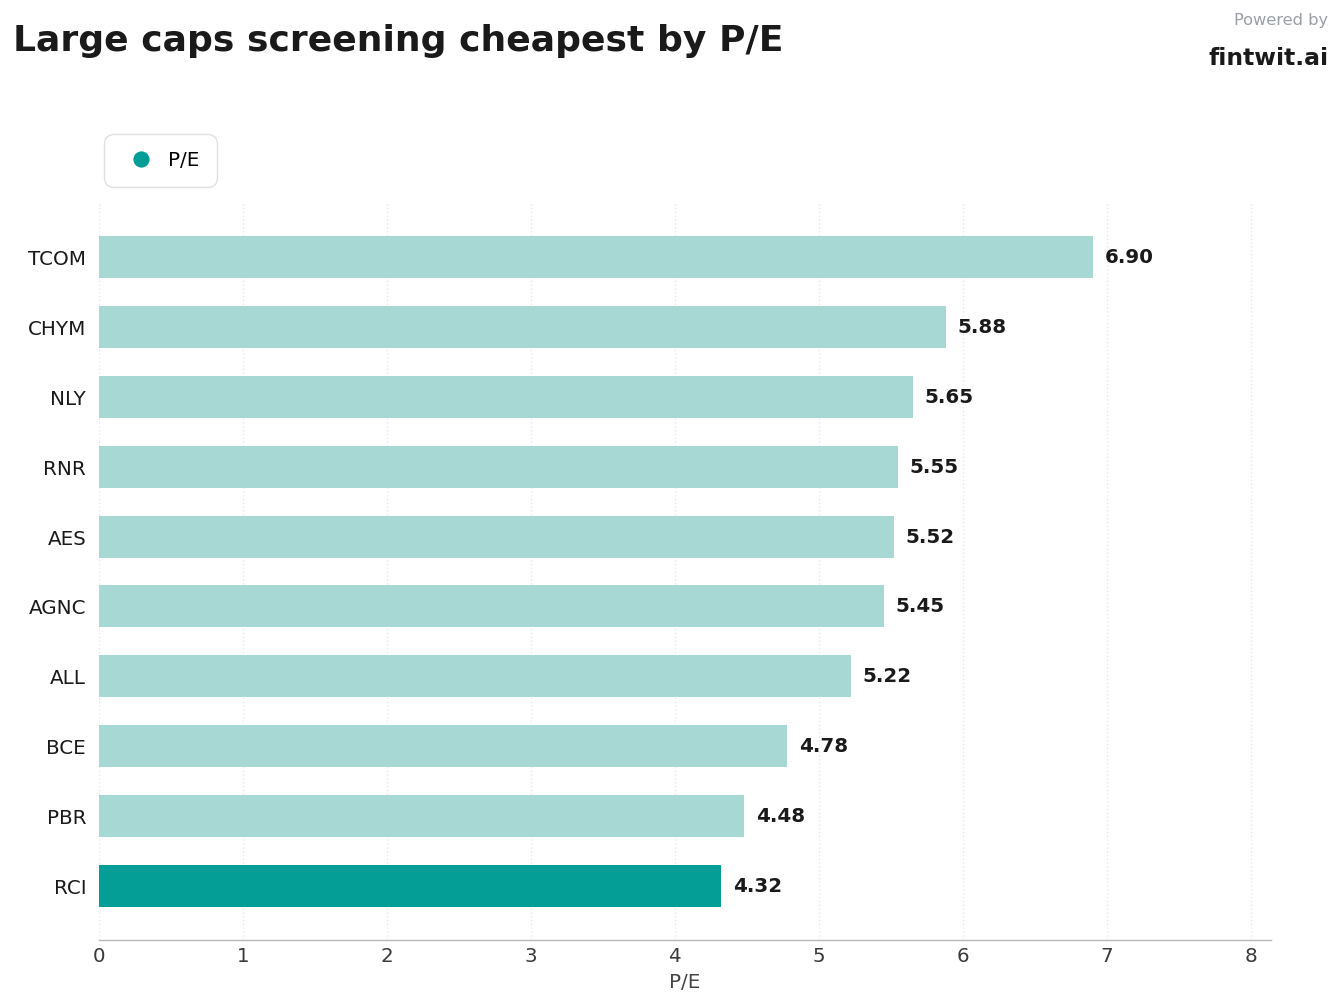
The following list details the 10 companies identified by our screen, highlighting the primary driver of their current valuation.
Investors should note that low P/E ratios often correlate with high dividend yields, but these yields can be unsustainable if earnings decline.
- RCI (Rogers Communications): P/E 4.32. Cheap due to stagnant service revenue growth. Analyst take: Flat service revenue is due to lower revenue per user.
- PBR (Petroleo Brasileiro): P/E 4.48. Cheap due to structural governance risks. Analyst take: P/E reflects structural risk factors to a large degree.
- BCE (BCE Inc): P/E 4.78. Cheap due to earnings pressure and high leverage. Analyst take: Earnings expected to decline while revenue grows slowly.
- ALL (The Allstate Corporation): P/E 5.22. Cheap due to market skepticism. Analyst take: Trades well below the insurance industry average of 11.7x.
- AGNC (AGNC Investment Corp): P/E 5.45. Cheap due to negative convexity in Agency MBS. Analyst take: Vulnerable to interest rate volatility and mortgage spreads.
- AES (The AES Corporation): P/E 5.52. Cheap due to deal-completion risk. Analyst take: Trades in a tight range as investors price in regulatory pressures.
- RNR (Renaissancere Holdings): P/E 5.55. Cheap due to softer reinsurance pricing. Analyst take: Revenue expected to decline 7.1% annually over the next 3 years.
- NLY (Annaly Capital Management): P/E 5.65. Cheap due to interest rate sensitivity. Analyst take: Tight price action reflects low volatility in interest rate expectations.
- CHYM (Chime Financial): P/E 5.88. Cheap due to post-IPO volatility. Analyst take: Pullback presents a potential buying opportunity for fintech investors.
- TCOM (Trip.com Group): P/E 6.90. Cheap due to regulatory scrutiny. Analyst take: Regulatory reviews and new ticketing rules weigh on sentiment.
Caveats
Low P/E ratios are not a guarantee of future performance and often serve as a warning sign for value traps. Investors must evaluate the sustainability of the underlying business model before committing capital.
Market sentiment can remain depressed for extended periods, particularly in sectors facing regulatory or macroeconomic headwinds.
- High dividend yields, such as PBR's 20.6%, may be subject to dividend cuts if cash flow generation falters.
- Negative free cash flow, as seen in AES and NLY, indicates that earnings may not be supported by actual cash generation.
- Regulatory risks in China, specifically for TCOM, can lead to permanent impairment of business models regardless of current valuation.
- Interest rate volatility creates significant uncertainty for mortgage REITs like AGNC and NLY.
How to use this screen
Use this list as a starting point for fundamental analysis rather than a list of actionable buy recommendations. Focus on companies where the low valuation is driven by temporary sentiment rather than structural decay.
Compare the free cash flow yield against the P/E ratio to identify companies that are actually generating cash. A low P/E combined with negative free cash flow is a primary indicator of a potential value trap.