
How we screened
We filtered the universe of large-cap equities to isolate companies with P/E ratios below 7.0. This screen focuses on firms where current market pricing suggests significant skepticism regarding future earnings growth or balance sheet stability.
The resulting list highlights a mix of sectors including telecommunications, energy, and financial services. We categorize these as either earned value traps, where structural decline is evident, or unearned opportunities, where market sentiment may be overly punitive.
The list
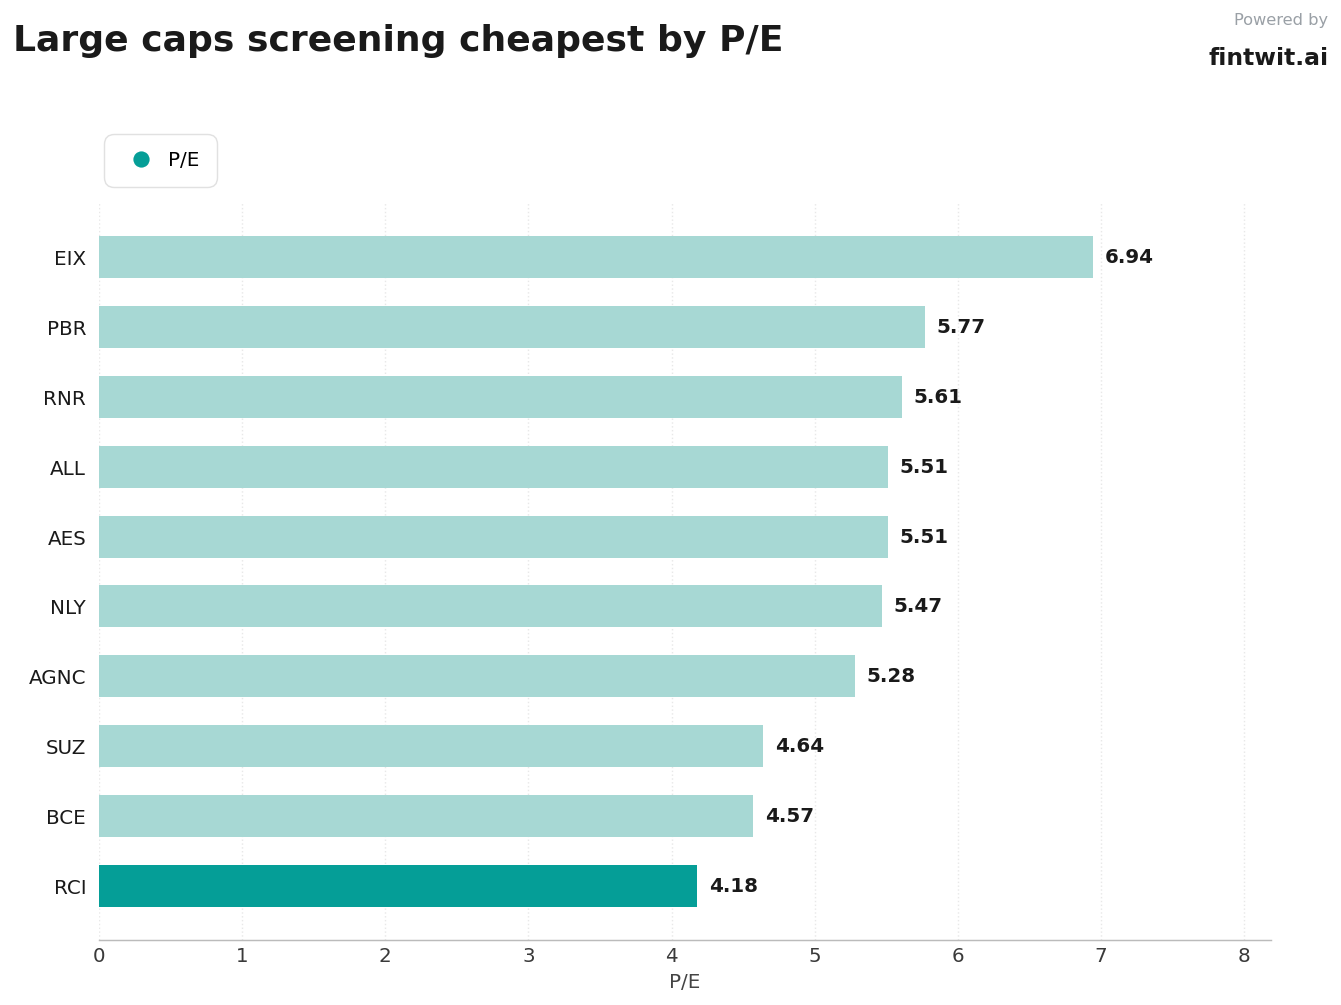
The following companies represent the lowest P/E multiples within our large-cap dataset. Each entry includes the current P/E ratio and the primary driver behind the market's current valuation discount.
- RCI (P/E 4.18): Market skepticism regarding debt levels and competitive wireless pricing pressure; analyst says increased cash flow affords management flexibility to pay down debt.
- BCE (P/E 4.57): Structural decline in wireline business and earnings pressure; analyst notes the tension between cheap trailing numbers and cautious forecasts will drive investor treatment.
- SUZ (P/E 4.64): Cyclical commodity headwinds and weak Chinese demand; analyst notes short-term sentiment is cautious as investors weigh commodity price cycles.
- AGNC (P/E 5.28): Interest rate sensitivity and spread widening concerns; analyst says valuations now seem high enough to debate fresh entries.
- NLY (P/E 5.47): Macroeconomic headwinds from term spread compression; analyst thesis is bearish due to rate hike and term spread compression.
- ALL (P/E 5.51): Historical catastrophe losses previously pressured margins; analyst says the turnaround is over, but the easy upside is gone.
- AES (P/E 5.51): Stock anchored by a pending $15.00/share cash acquisition price; analyst views this as a low-risk arbitrage play.
- RNR (P/E 5.61): Concerns over catastrophe losses and softening reinsurance pricing; analyst says the narrative leans on shrinking revenues and higher future multiples.
- PBR (P/E 5.77): Governance risks and political interference; analyst says the cheap P/E reflects structural risk factors to a large degree.
- EIX (P/E 6.94): Ongoing liability and funding uncertainty related to wildfire exposure; analyst questions whether the discount is too harsh or a fair reflection of liability.
Caveats
Low P/E ratios are often a reflection of market efficiency rather than an oversight. Investors must distinguish between temporary cyclical downturns and permanent impairment of the underlying business model.
The following risks are inherent to the companies identified in this screen.
- High debt-to-equity ratios in telecom names like RCI and BCE limit capital allocation flexibility.
- Regulatory and political interference remains a primary risk factor for state-linked entities like PBR.
- Catastrophe-exposed insurers like ALL and RNR face non-linear risks that can wipe out earnings in a single quarter.
- Interest rate volatility continues to threaten the net interest margin of mortgage REITs like AGNC and NLY.
How to use this screen
This data should serve as a starting point for fundamental due diligence rather than a list of actionable buys. A low P/E is a signal to investigate the sustainability of cash flows and the validity of the market's bearish thesis.
Investors should prioritize companies with high free cash flow yields, such as RNR at 31.42% or ALL at 21.61%, over those with negative free cash flow, such as EIX or AES, when evaluating long-term viability.